Welcome Back to Win-Win Democracy
In our journey to address four existential threats to our American democracy — the rise of the ultra-wealthy, corporate wealth and power, economic resentment, and defanged campaign finance laws — we continue and expand our discussion from last time about how our tax system redistributes wealth.
Often, the phrase “redistribution of wealth” is used to conjure up a frightening image of wealth being confiscated from hard-working, deserving people like “us” and given to lazy, undeserving people like “them.” But, as we started to see last time, tax breaks deliver large benefits to the highest earners among us in ways that don’t appear in any federal budget and are poorly understood by the public.
My purpose here is not to debate how much or even whether we should help the poor, but rather to help get past the rhetoric about redistribution of wealth and understand what we actually do. To discuss how we might want to change our tax and social support systems, we should first understand what we do currently.
Tax Expenditures are Real Expenditures
Remember from last time that tax expenditures are defined as tax breaks that cause tax revenues to be lower than they would be according to normal tax law, the so-called reference tax law. I claimed, without any justification, that the name is apropos because tax expenditures are no different than a typical expenditure except that they don’t appear as outlays in the budget1 and don’t have to be appropriated.
Not everyone agrees. Some people say: Tax expenditures are just tax reductions and tax reductions are always good because [insert rationale here]. It doesn’t cost anything to reduce taxes.
Here’s why that’s wrong.
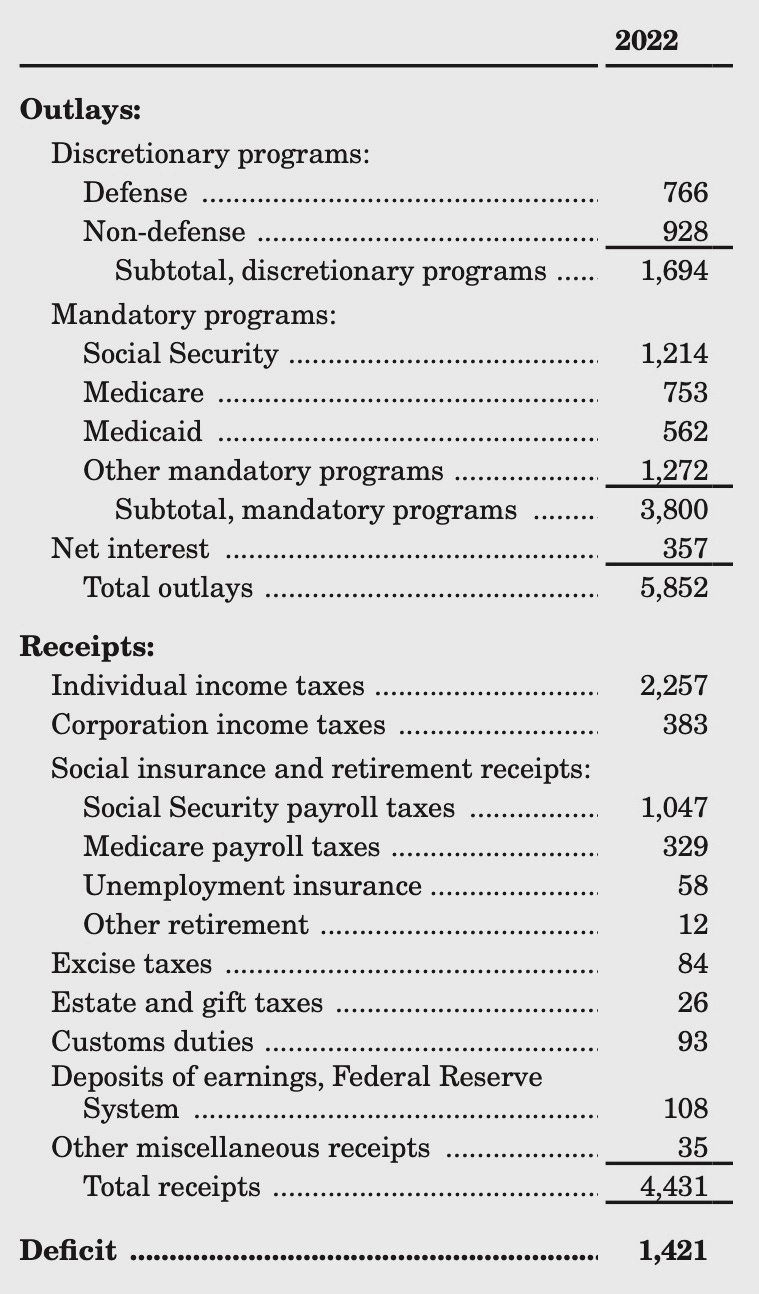
The federal budget for FY 2023 is a 153-page document that is heavy on political messaging and cabinet-level strategies, getting to the numbers on page 119. The 2022 budget calls for $4.4 T (yes, trillion) in receipts and $5.8 T in outlays, yielding a deficit of $1.4T. Here’s the overview for 20222, with numbers in billions of dollars:
The receipts are estimates based on current tax law, i.e., including the reduction in tax revenue caused by various tax expenditures.
Suppose Congress wants to spend $50B to encourage adoption of residential solar energy. How might they do that? Here are two possibilities:
Fund a $50B grant program, housed in some federal agency, that will request proposals, decide which proposals to fund, and allocate the $50B.
Offer a tax deduction (or tax credit) for investments in residential solar energy.
The grant program would appear in the budget under discretionary programs, non-defense, causing the total outlays and the deficit to rise by $50B.
The tax deduction/credit approach works differently: Congress would establish criteria and any taxpayer that meets the criteria would claim the deduction/credit. As part of the budgeting process, Congress would ask the Congressional Budget Office to estimate the impact of the deduction/credit on tax revenue. That would be reflected in a smaller number for individual income tax receipts, causing the deficit to rise by the impact on tax revenue.
In the grant approach, the cost is known: We’re going to spend $50B. In the tax deduction/credit approach, an entitlement is created and the actual cost depends on how many people meet the criteria, which can be estimated but not controlled.
Either way, the deficit rises unless some offsetting reduction in outlays or increase in receipts occurs.
Tax expenditures affect the budget just like any other expenditure except that the size of the expenditure can only be estimated, not controlled.
The Scope of Tax Expenditures
I lied a bit when I said that the budget document is 153 pages. That’s just the main body. There’s another 332 pages of Analytical Perspectives. Tucked away in Chapter 13 of the Analytical Perspectives is a 49-page discussion of tax expenditures. Turns out that the Congressional Budget Act of 1974 requires a list of tax expenditures to be included in the budget document, so there it is.
It is difficult to appreciate the magnitude and scope of our tax expenditures without looking at Table 13-1 in this document, which estimates total tax (corporate and individual) expenditures. I strongly urge you to skim this table, which appears on pages 156-162.
I also urge you to skim Table 13-3, which ranks the tax expenditures by total fiscal year 2022-2031 projected revenue effect, to get a view of the wide range of tax expenditures in our system and the huge magnitude of their revenue impact.
It is important to understand, however, that these revenue impacts are estimates based on current behaviors. If we eliminated a particular tax expenditure, behaviors might change, causing the increased revenue to be less than the current estimate of the tax expenditure’s size. For example, if we eliminated the deductibility of mortgage interest, there might be fewer or smaller mortgages so the actual revenue increase could be smaller than the current tax expenditure.
Who Benefits from Tax Expenditures?
Both individuals and corporations benefit from tax expenditures. In 2021, the three largest sources of revenue for the federal government were:
Individual income taxes: $2T (51%)
Social Security and Medicare Taxes: $1.2T (31%)
Corporate Income Taxes $371.8B (9%)
While revenue from corporate income taxes is significant on an absolute scale, it is swamped by revenue from individual income taxes and from social security and medicare taxes (collectively called payroll taxes). So, here, we’re going to focus on tax expenditures that benefit individuals.
Before heading there, I’ll mention that I totaled the corporate tax expenditures for FY 2022 listed in the budget document; they came to $103B. This number is not directly comparable to the $371.8B figure for corporate income taxes (different year; projections vs. actual) but at least gives some sense of the magnitude of tax expenditures benefiting corporations: Corporate tax expenditures are roughly a quarter of corporate income tax revenues.
Now, to tax expenditures that benefit individuals. As you saw (you did look at Table 13-1, didn’t you?), there are way too many tax expenditures to analyze them all.
Fortunately, the well-respected Congressional Budget Office has analyzed “how the benefits from major tax expenditures in the individual income tax and payroll tax systems were distributed among households in different income groups in 2019.” The CBO’s analysis is 40 pages. I’m going to give a much shorter summary of what I consider their key findings. If you’re interested in such matters, it is well worth reading the entire report.
A Sense of Scale
Next time you hear a politician says “we can’t afford to …”, think about these data:
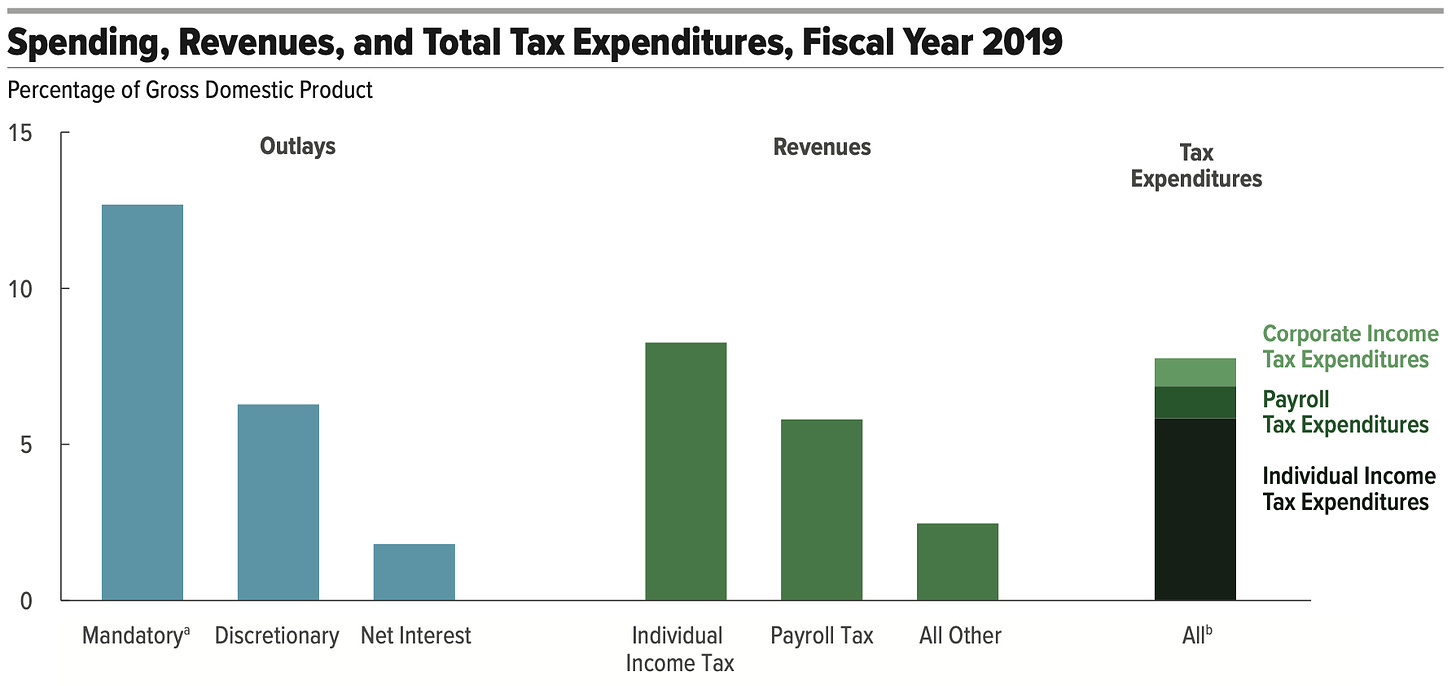
Tax expenditures (corporate and individual) totaled $1.6T, which is 7.8% of GDP and larger than the federal budget deficit
Tax expenditures are as big as nearly half of all federal revenues
Tax expenditures are larger than all discretionary outlays in the budget
Tax expenditures are larger than 60% of all mandatory spending in the budget
This chart puts it visually:
Distribution of Benefits of the Heavy Hitter Tax Expenditures
The CBO selected the tax expenditures that comprised the largest tax expenditures in the individual income tax system in 2019. This year was pre-pandemic so the data are not altered by the extraordinary actions taken to help us through an emergency. It is also after implementation of the 2017 tax cuts, so the data does reflect reductions in tax expenditures implemented by that legislation.
These selected tax expenditures represent about three quarters of the total tax expenditures for 2019.
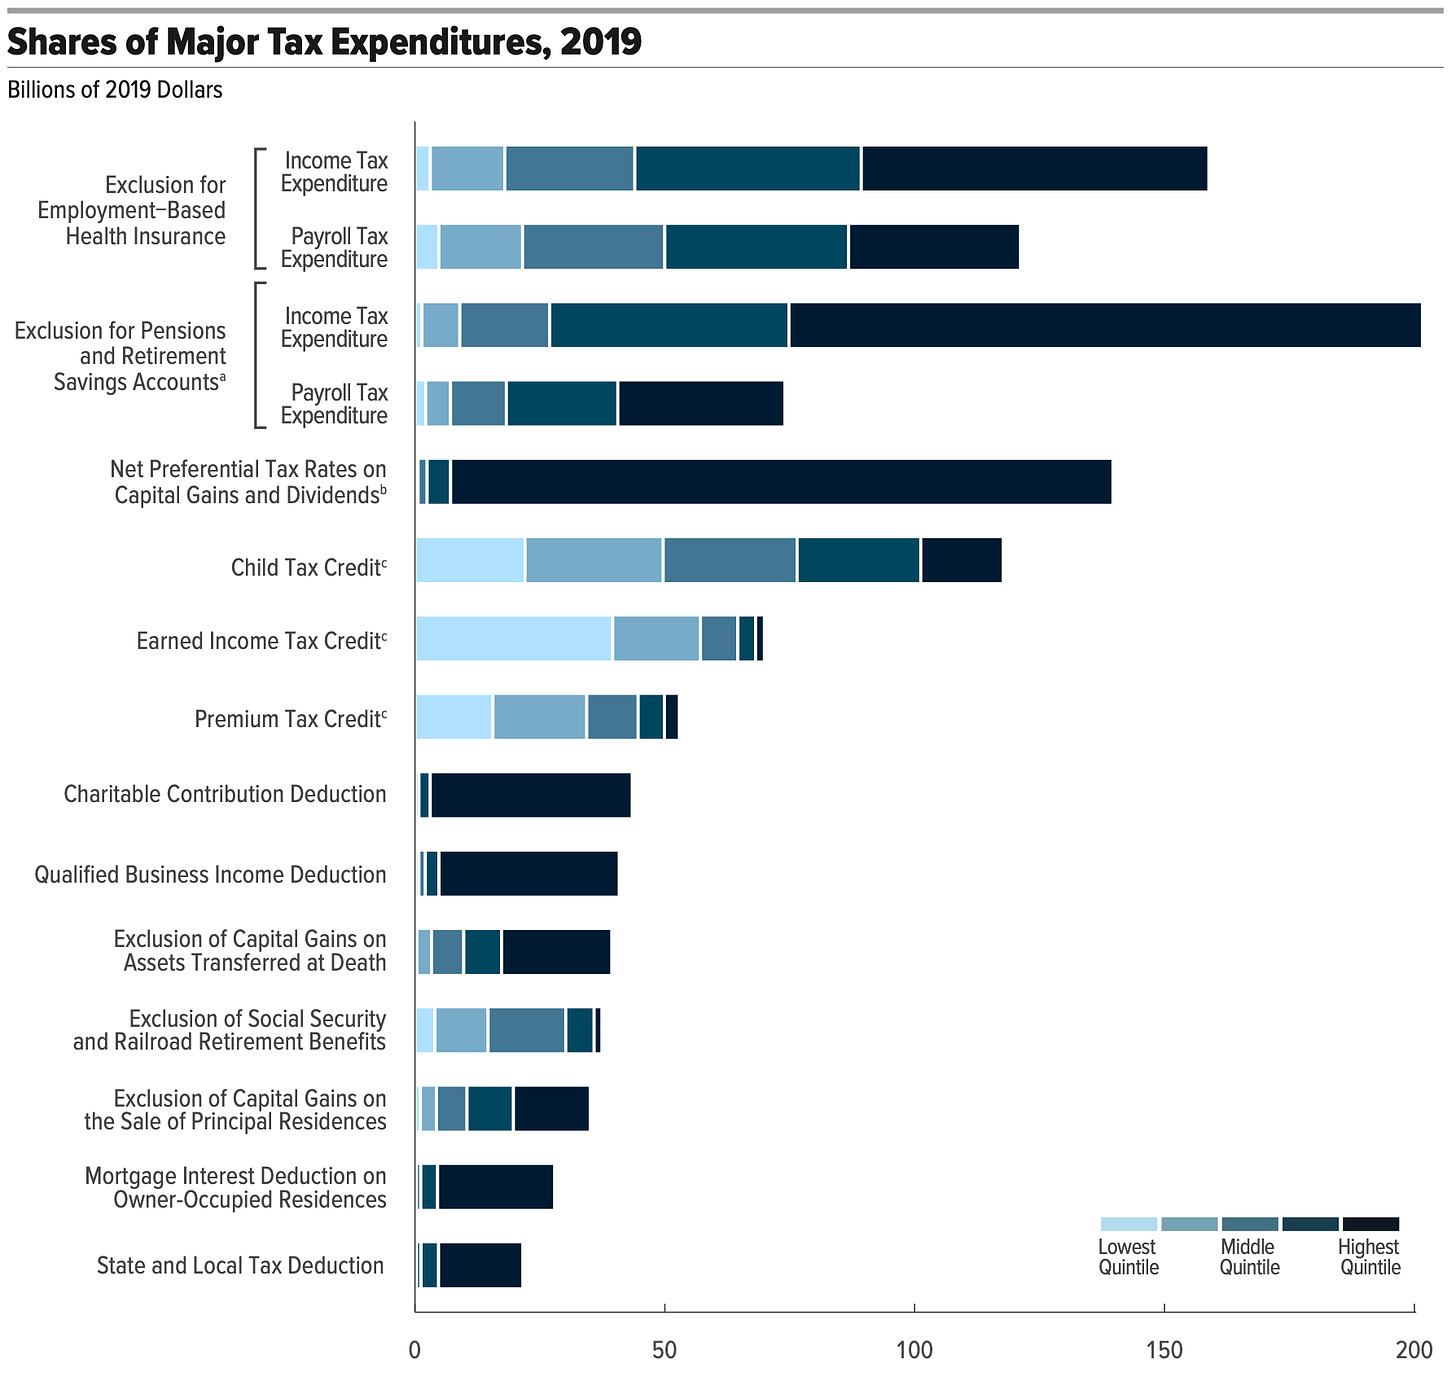
Here’s the summary chart:
For each of the tax expenditures listed, the horizontal bar shows the total size of the tax expenditure. I’ll explain some of these tax expenditures below. Two of the tax expenditures affect both income tax receipts and payroll tax receipts; separate bars are shown for each.
Each bar is partitioned into five segments, each corresponding to a quintile of household income3. The quintiles are based on surveys of household income conducted by the Census Bureau. Conceptually, the incomes of all of the households in the country are sorted from lowest to highest, then the lowest quintile is the lowest 20% of households, the second quintile is the next 20%, and so forth.
For 2019, the quintile upper limits were:
Lowest: $27,088
Second: $51,633
Third (middle): $81,947
Fourth: $131,349
Fifth (highest): unlimited. The lower limit of the top 5% is $250,000.
The length of a quintile’s segment of a tax expenditure’s bar shows the amount of benefit from that tax expenditure that accrues to households in that quintile.
You can see that for most of the tax expenditures the largest benefit accrues to households in the highest quintile, while for one tax expenditure (earned income tax credit) the largest benefit flows to households in the lowest quintile.
Summing across all of the major tax expenditures, we can see how much of the combined benefits go to each quintile, for both income tax expenditures and payroll tax expenditures:
About half of the benefits from income tax expenditures and a third of the benefits of the payroll tax expenditures flow to the 20% of households in the highest quintile. The 20% of households in the lowest quintile get about 9% and 4%, respectively, of the benefits. Note, also, that within the highest quintile, the top 1% do especially well.
What Are the Big Tax Expenditures?
It is worthwhile understanding a bit about some of the biggest tax expenditures.
Exclusion for Employment-Based Health Insurance
When an employer provides health insurance to an employee, the insurance premium is excluded as income to the employee. Neither the employee nor the employer pay tax on the premium; indeed, the employer can deduct the premium as an ordinary business expense when filing corporate income taxes. At $280B, the exclusion from the employees’ income constitutes the largest tax expenditure. Two-thirds of the benefit accrues to households in the top two quintiles.
Exclusion for Pensions and Retirement Savings Accounts
Savings for retirement, in the form of pensions and multiple flavors of IRAs, are given special tax treatment, through a variety of mechanisms, including deductions of contributions, deferral of tax until retirement, tax-free investment earnings, etc. At $276B, this exclusion is the second largest tax expenditure. Fifty-eight percent of the benefit accrues to households in the top quintile, with another quarter accruing to households in the fourth quintile.
Preferential Treatment of Capital Gains and Dividends
We discussed this tax expenditure in the previous newsletter. The preferential rates result in a $174B tax expenditure, which is offset by $34B in tax revenue from the net investment income tax, yielding a $140B net tax expenditure. The benefits of this tax expenditure accrue 95% to the top quintile; indeed, 75% accrues to just the top 1%.
The CBO’s analysis does not include any tax expenditure from the deferral of taxes on unrealized capital gains. It is difficult to estimate how much tax revenue is lost by deferring taxes on unrealized gains, and I haven’t been able to find any such estimate. As we saw, however, taxing capital gains annually instead of deferring taxation until the gain is realized can have an enormous impact on wealth accumulation.
Child, Earned Income, and Premium Tax Credits
There are three major tax expenditures that help primarily lower-income households and households with dependent children:
Child Tax Credit: Taxpayers with children under age 17 could receive up to $2,000 per child, with a $500 credit for older dependent children. The credits are partially refundable4 and are reduced for taxpayers with income above $200,000 ($400,000 for joint filers).
Earned Income Tax Credit: Low-income workers receive this fully-refundable credit, with the amount depending on income and number of children. More than half of households in the lowest quintile benefited from the credit, and 56% of the benefit accrued to those households.
Note that the earned income tax credit also appears as an outlay in the federal budget, presumably so that Congress can point to this major source of help for our country’s poorest people. The CBO does not double count this.Premium Tax Credit: People with modified adjusted gross income between 100% and 400% of the Federal Poverty Level who obtain health insurance via Obamacare receive subsidies in the form of a tax credit. Eighty-four percent of the benefit accrues to households in the lower three quartiles.
Others
I’m going to spare you the details on the remaining major tax expenditures. You can find good explanations of all of them in the CBO report.
I do want to discuss the impact on tax expenditures of the 2017 tax act: It reduced the major tax expenditures listed in the CBO report by 9%. The tax act is due to expire in 2026 (unless renewed), restoring some previous tax expenditures and reducing eligibility for the child tax credit. Most of the benefit of the additional tax expenditures under the 2026 rules will accrue to the top quintile. This means that the 2017 tax act temporarily made our tax expenditures more progressive.
Wealth Redistribution
We can now get to the big question: How do we redistribute wealth in our system? In particular, is the mantra that we redistribute wealth from high-income people to poor people true?
According to an analysis by the Urban Institute, in 2019 the federal government spent $483B on what is ordinarily considered welfare, providing help to poor people. State and local governments spent an additional $261B.
Compare this to our federal tax expenditures. From Figure 55 of the CBO report (above), I’ve computed the total tax expenditure (income tax plus payroll tax) that accrues to households in each quintile:
Highest quintile: $561.8B
Fourth quintile: $240B
Middle quintile: $172B
Second quintile: $132B
Lowest quintile: $94.2B
From these data, you can see that the federal government spends more in tax expenditures for the highest quintile than it spends on welfare, and the federal government spends more in tax expenditures for the highest two quintiles than the entire cost of welfare programs (i.e., including the contribution from state and local governments) plus the cost of the tax expenditures for the lowest quintile.
Moreover, the CBO analysis does not consider the tax expenditure from deferred taxation of capital gains. This is likely a very large number (but difficult or impossible to compute) with almost all benefit accruing to the top quintile (because 95% of the benefit of the preferential treatment of capital gains and dividends accrues to the top quintile).
In other words, the real tax expenditure benefit accruing to the top quintile is likely substantially larger than shown in the CBO analysis.
Many states also have tax expenditures, usually modeled after the federal ones. It is likely (but I do not have data to prove) that the benefits of state tax expenditures are similarly distributed as the federal ones.
Even ignoring the fact that the capital gains tax expenditure is larger than reported and the role of state tax expenditures, we can conclude that:
The federal government spends more on tax breaks for the highest quintile than it does on welfare programs.
The federal government spends more on tax breaks for the highest two quintiles than the combined outlay by federal, state, and local governments for welfare and the benefits of tax expenditures that accrue to the lowest quintile.
What Next?
On our path to propose win-win approaches to reducing threats to our democracy, we’ve been discussing how our tax system helps high earners accumulate wealth. To be honest, we’ve only scratched the surface of that topic, but I think we have enough appreciation of how the system works to be able to move on.
In the next few newsletters, we’ll discuss growing corporate wealth and power and how our defanged campaign finance laws give wealthy individuals and corporations extraordinary influence on our politics.
Most of them don’t appear in the budget, but the earned income tax credit does for some reason. I can only guess why: Listing the earned income tax credit as an outlay allows politicians to discuss it with their voters, either to praise it for helping low-income wage earners, or to denigrate it as welfare for the undeserving poor.
I chose to look at 2022 numbers so we don’t get confused by proposed changes to be made in FY 2023.
I want to emphasize that we are talking about household income, not household wealth. Of course, a high-wealth household is likely to also have high income.
A tax credit is refundable if it is paid even if the taxpayer’s income tax is less than the credit.
The data behind the figures in the CBO report is available as a spreadsheet, making it easy to compute such data.


This blog keeps getting more and more interesting. Thanks for this topic - I've not seen a lot of press coverage on this before. Keep it up.
Wow… that is quite a lot of information to digest and to comment on. I need to read it through a few more times. It does occur to me that the complexity of our tax structure and the financial hierarchy of our society is quite purposeful and intentional. I wonder if this was the intention of Hamilton, or if over 250 years human nature took over and it evolved into the system we currently have?